Zoom Electric: Sales Analysis
I worked on the Zoom Electric- Sales Analysis project. I will be diving into the background, my full process of extracting and analyzing the data, along with my final summary and insights of the data.
Tools Used: MySQL | Microsoft ExcelQuick Links: SQL Query | GitHub Repository
Below is a table of contents in case you want to go to any section.
Table Contents:
- Background
- Data Dictionary
- Process
- Finished Project
- Overview of Data
- Insights
- What I Learned
- Resources
BACKGROUND
Zoom Electric (ZE) is an electric vehicle venture owned by a renowned automotive manufacturer called ZOOM MOTORS India Private Limited.
Zoom Electric offers a range of automotive and scooter products, including FioNex, Sprint, and Parker, along with some exclusive limited-edition variants.
Recently, ZE introduced a new scooter model called Sprint in the 2-wheeler EV scooter segment. Initially, the sales numbers for Sprint Scooters were quite impressive during the first two weeks of its launch. However, unexpectedly, there was a sudden decline in sales thereafter.
My Role: In this scenario I am working as an analyst in the sales & operation team at Zoom Electric (ZE). My team is responsible for executing the pre-orders, sales client visits, and website sales, and analyze the visit session created on the website, and analyzing the sales funnel. And my team has been tasked with the overall goal (see below) of sales & operation strategies.
Overall Goal: As a data analyst, I have been assigned to validate the sales drop for Sprint scooters and figure out the reasons for this decline.
Approach: To find the reason for decline in sales precisely, the overall goal is divided into three sub-goals:
DATA DICTIONARY
Entity Relationship Diagram
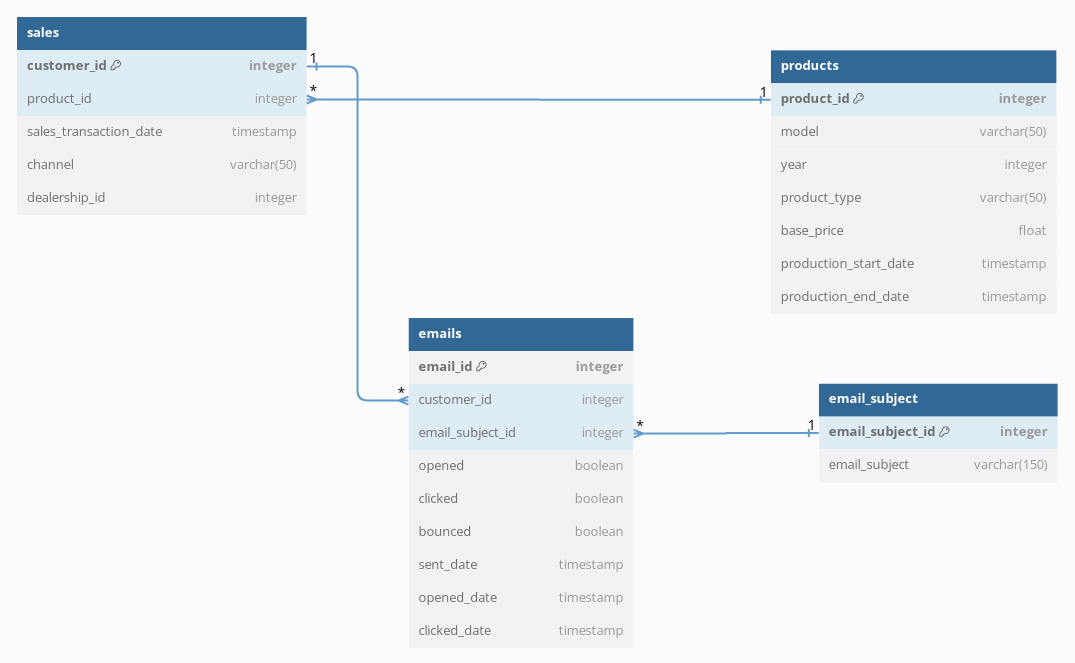
A table to show details regarding sales.1. Sales
Table Schema
Sample Data
A table to show details of the products.2. Products
Table Schema
Sample Data
A table to show data of email marketing.3. Emails
Table Schema
Sample Data
A table to show details of employees.4. Email subject
Table Schema
Sample Data
PROCESS
Overview: I first familiarized myself with the dataset, tables and fields separately in Excel, then used MySQL to create a database using those datasets to extract the required data. Finally I returned to Excel to analyse those extracted data using pivot tables and graphs.
Microsoft Excel
I downloaded all the CSV files and familiarized myself with the data first.
Then I used MySQL to create database for data extraction purpose because the files were quite large to filter and processing those files in Excel would have taken a long time. And then I came back to Excel to analyse the data, I did this 3 times for each sub-goal.
I've streamlined the comprehension of process section by adding goto tags.
1. Quantify the decline in sales growth. (goto extraction)
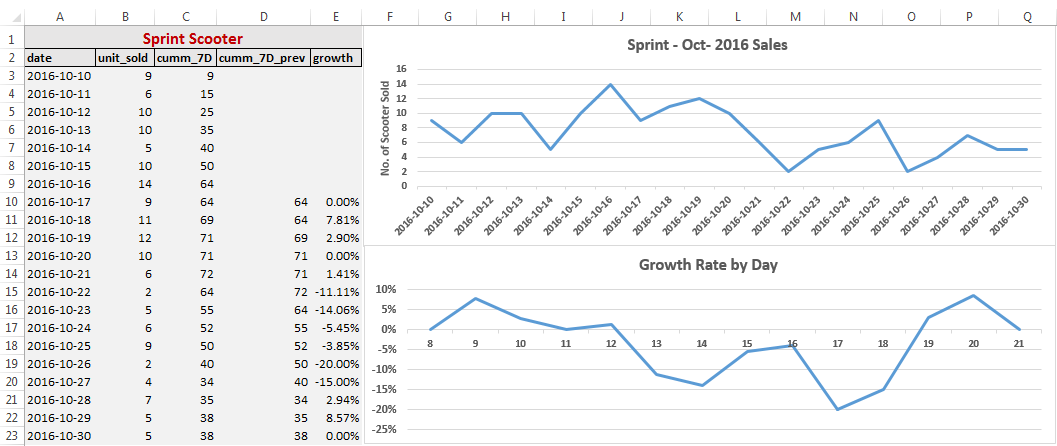 You can see there are (-ve) values in the growth column that confirms there has been a decline in sales volume.
2. Assess the relationship between launch date and sales growth. (goto extraction)
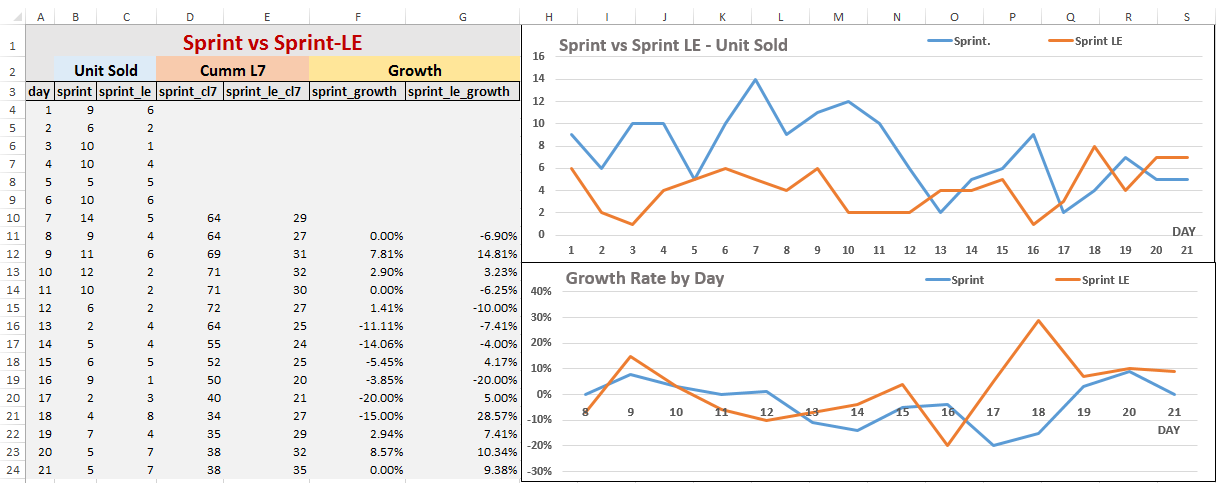 The Sprint scooter came out in 4th quarter whereas every other scooter models came out in the 1st or 2nd quarter.
At the start, the Sprint scooter sold more in the first days, but later on, the Sprint LE caught up and did even better. The Sprint scooter's sales dropped quickly after 10 days, while the Sprint LE's sales went down more slowly. The Sprint scooter sold more each day on average. In the first week, the Sprint grew faster, but then slowed down. The Sprint LE's growth stayed steady. Eventually, the Sprint scooter's growth went down, while the Sprint LE kept growing.
3. Assess the effectiveness of email campaign in influencing customers’ purchasing decisions. (goto extraction)
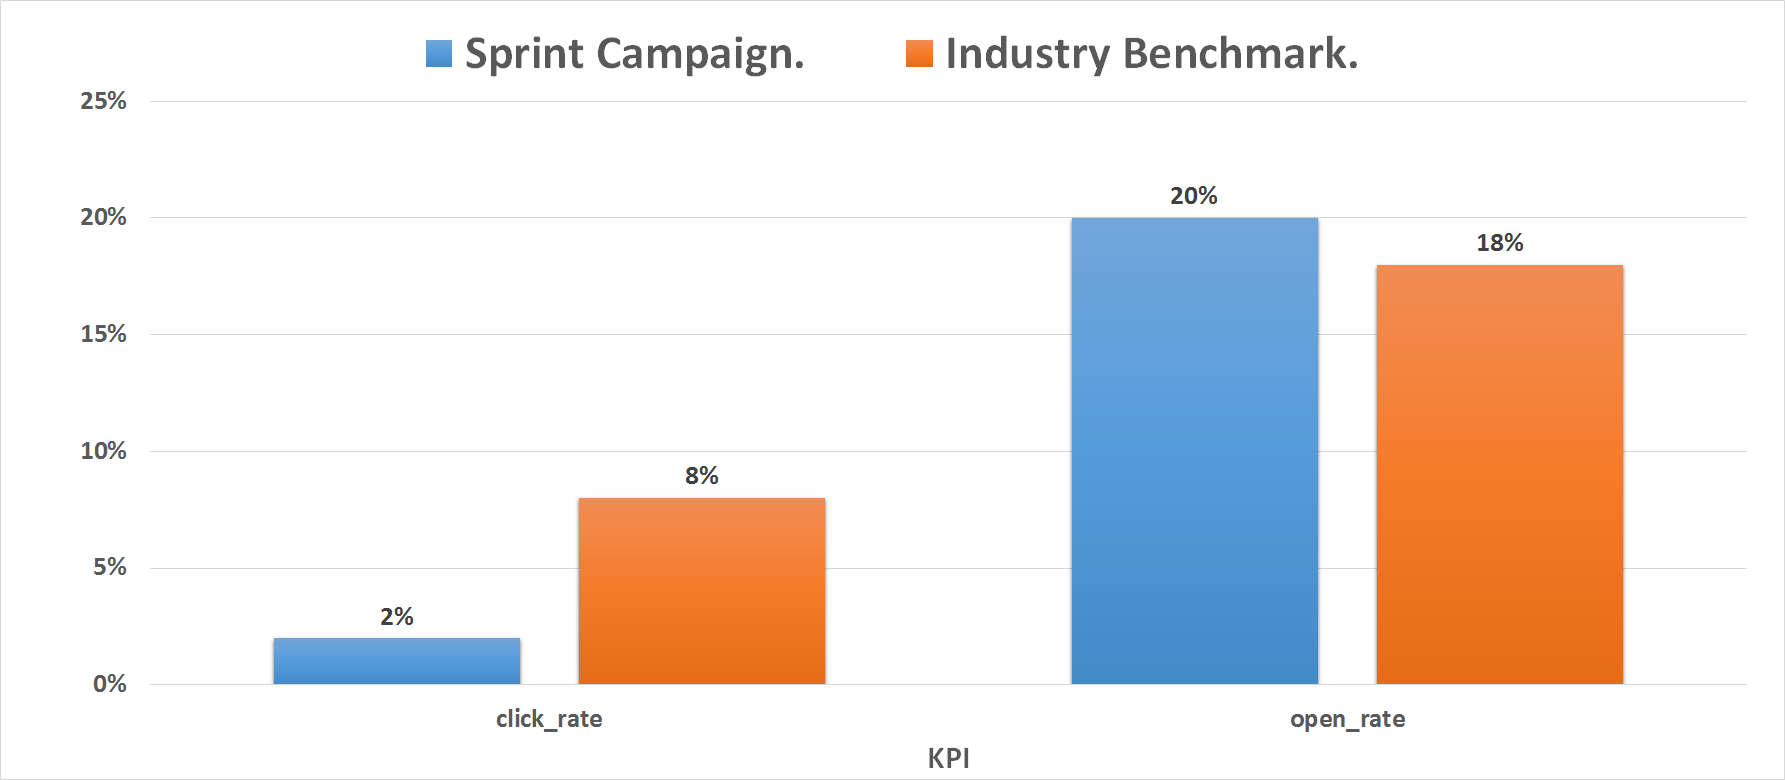
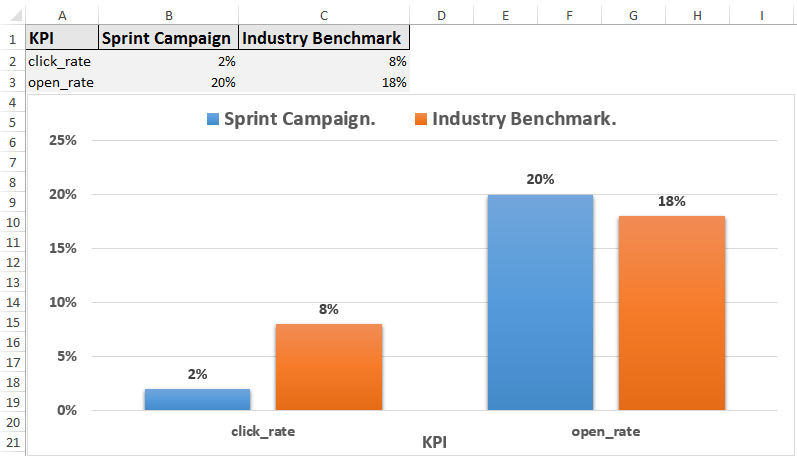 The CTR is the percentage of people who clicked on a link in the email, while the open rate is the percentage of people who opened the email.
The CTR is 2%, which is below the industry benchmark of 8%. This means that only 2% of the people who received the email clicked on a link in the email. The open rate is 20%, which is slightly above the industry benchmark of 18%. This means that 20% of the people who received the email opened it.
MySQL
I originally wanted to use Excel but the files were too big to filter and it was difficult to process for my computer. Instead I used SQL to extract the data because it could handle all of the information quicker than Excel, and I wanted to work on my SQL-querying skills. Below is my general process in SQL, I didn't include my mistakes/missteps or errors for the sake of brevity.
View my full code on my GitHub for this project here.
Uploaded all of the original data from the data source into MySQL database, used MySQL Workbench to import all individual CSV files and save them in separate tables and created a database.
I extracted 3 data tables based on the sub-goals:
1. Quantify the decline in sales growth.
Extracted the data relevant to the business problem ie, no. of “Sprint” scooters sold in the first 3 weeks (21 days) of its production start date and named it sprint_sales with following structure.
date – to store the sales transaction date.
unit_sold – to calculate and store the total no. of sprint scooter sold on each date.
Added 3 new columns:
cumm_7D – to calculate rolling sum of 7 days period of unit_sold for consistent evaluation of sales performance throughout the week.
cumm_7D_prev – to store the previous day’s value of cumm_7D
growth – to calculate the growth% or change in sales of current day and previous day, a positive value shows increase in sales while a negative value shows a decline in sales, to calculate growth please refer to this formula:
growth = 100 * (cumm_7D - cumm_7D_prev) / cumm_7D_prev
Note: The sales_transaction_date column was of datetime date-type so I had to cast DATE() function in order to get total unit sold on each day.
view query
view data
2. Assess the relationship between launch date and sales growth.
To find the relationship between launch date and sales growth, I extracted the sales data for another scooter model named “Sprint Limited Edition” to compare with “Sprint” model.
Sprint Limited Edition’s sales data table has same structure as Sprint’s sales data table.
Then I joined both the data tables and created a new table of following structure.
day – to store the no. of days(1-21) since the date column values in both the tables were different so it was of no use.
sprint – to store the unit_sold column values from Sprint sales data table.
sprint_le - to store the unit_sold column values from Sprint Limited Edition sales data table.
sprint_cl7 - to store the cumm_7D column values from Sprint sales data table.
sprint_le_cl7 - to store the cumm_7D column values from Sprint Limited Edition sales data table.
growth_sprint - to store the growth column values from Sprint sales data table.
growth_sprint_le - to store the growth column values from Sprint Limited Edition sales data table.
view query
view data
3. Assess the effectiveness of email campaign in influencing customers’ purchasing decisions.
Analyzing the email opening rate and click-through rates, as well as comparing them to industry benchmarks, will enable the evaluation of the effectiveness and quality of the email campaign. This will provide insights into how well the campaign engages recipients, whether they open the emails, and if they click on the provided links, helping to measure the overall impact and success of the campaign.
I extracted the data from emails table where the sent date was between the production start date of “Sprint” model and two months before it.
Then, I summarized those data in a different table called sprint_camp_summary with following structure:
email_sent – to store the total count of rows sprint_campaign table.
clicked – to store the total count of rows where clicked values were 't' in sprint_campaign table.
opened – to store the total count of rows where opened values were 't' in sprint_campaign table.
bounced – to store the total count of rows where bounced values were 't' in sprint_campaign table.
I further summarized it to calculate the campaign Key Performance Indicators (KPI) to compare it with industry benchmark and named it campaign_performance_kpi with following structure:
click_rate – to calculate and store the click through rate of emails clicked
open_rate – to calculate and store the emails opening rate.
To calculate the click_rate and open_rate please refer the formula below:
click_rate = 100 * (clicked / (email_sent – bounced))
open_rate = 100 * (opened / (email_sent – bounced))
view query
view data
Misc.
Microsoft Word
- Resources - A list of resources I frequently used.
- Notes - Notes for the project including the final insights, what I was looking for, and anything else having to do with the project.
FINISHED PROJECT
Here is my finished project: Zoom Electric: Sales Analysis.
View my SQL queries on Github used for data extraction
here and the Excel files for analysis
here.
OVERVIEW OF DATA
Data:
Sprint Sales Data
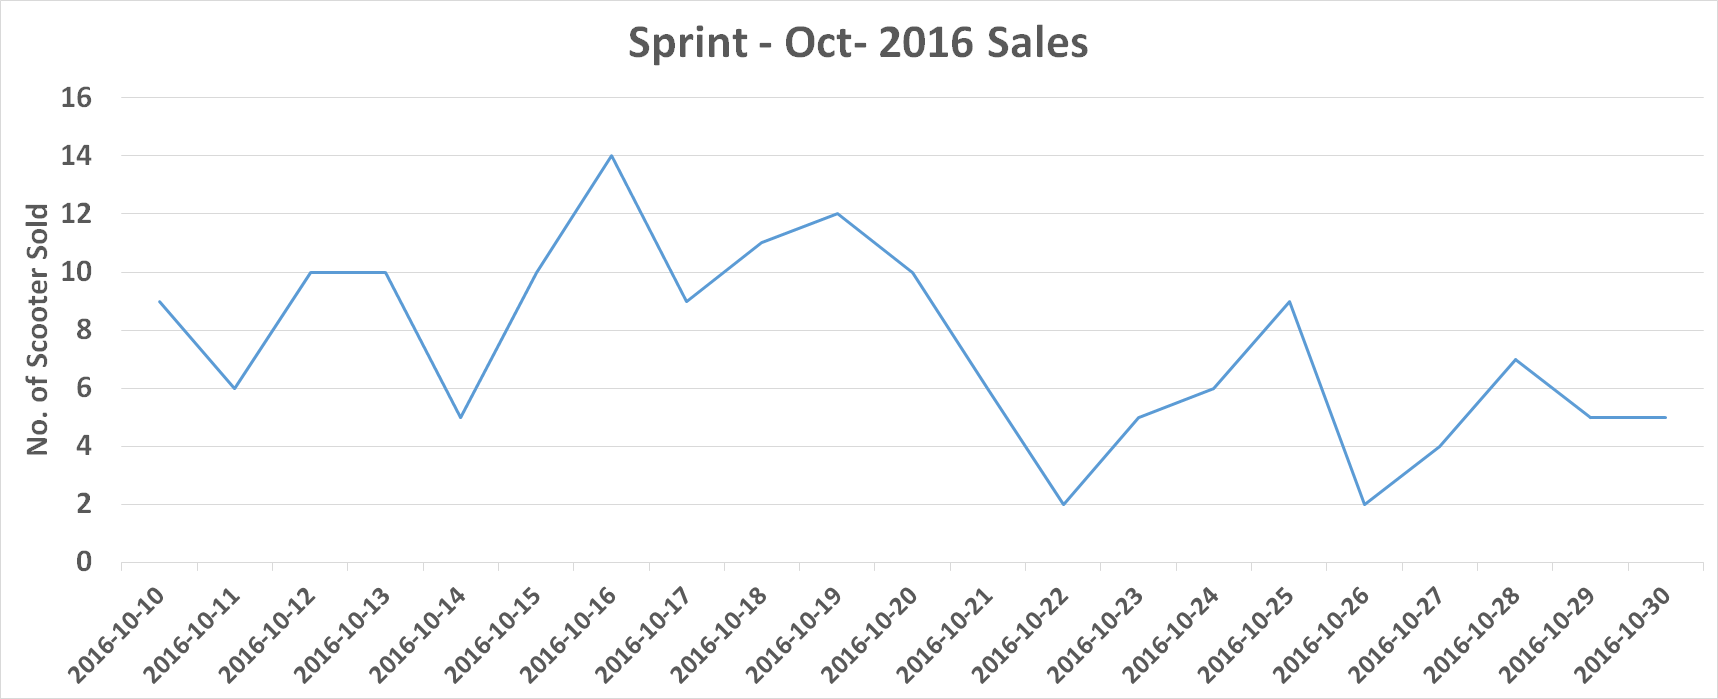 • The sales of the Sprint scooter started off strong, with over 100 units sold in the first few days of the month.
• The sales then declined steadily, with only a few units sold in the last few days of the month.
• The average daily sales for the month were around 50 units.
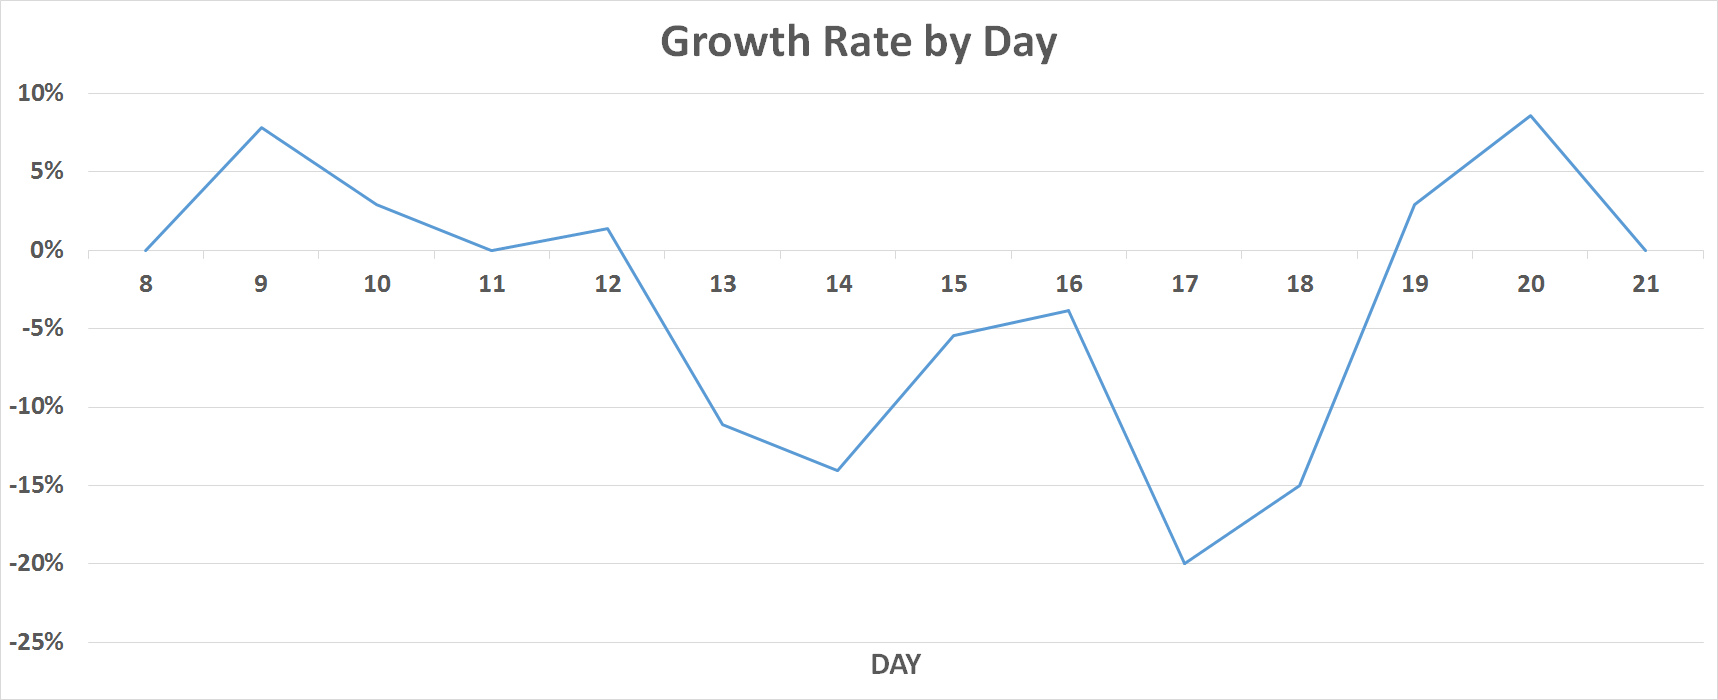 • The growth rate of the Sprint scooter was positive in the first 7 days after launch, but it declined steadily after that.
• The growth rate of the Sprint scooter became negative on day 15 and remained negative for the rest of the month.
• The average daily growth rate for the month was -2%.
Based on these insights, it is clear that there was a decline in the sales of the Sprint scooter in October 2016. The decline in sales started after the initial hype around the product died down.
Sprint vs Sprint Limited Edition
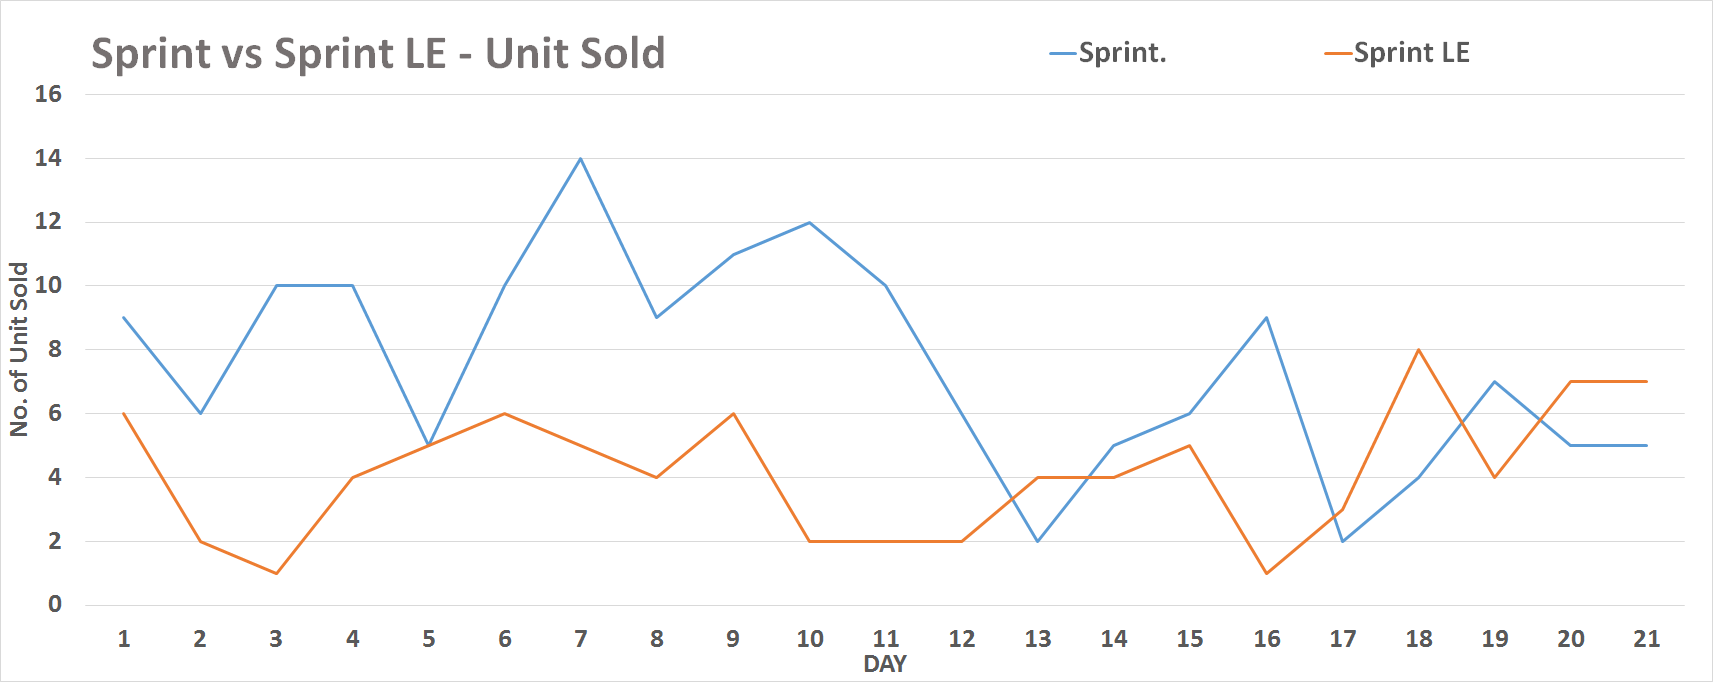 On comparing "Sprint" with "Sprint Limited Edition" sales data we see that:
• The Sprint scooter had higher sales in the first few days after launch, but the Sprint LE scooter eventually caught up and surpassed it.
• The Sprint scooter had a sharp decline in sales after day 10, while the Sprint LE scooter had a more gradual decline.
• The Sprint scooter had a higher average daily sales than the Sprint LE scooter.
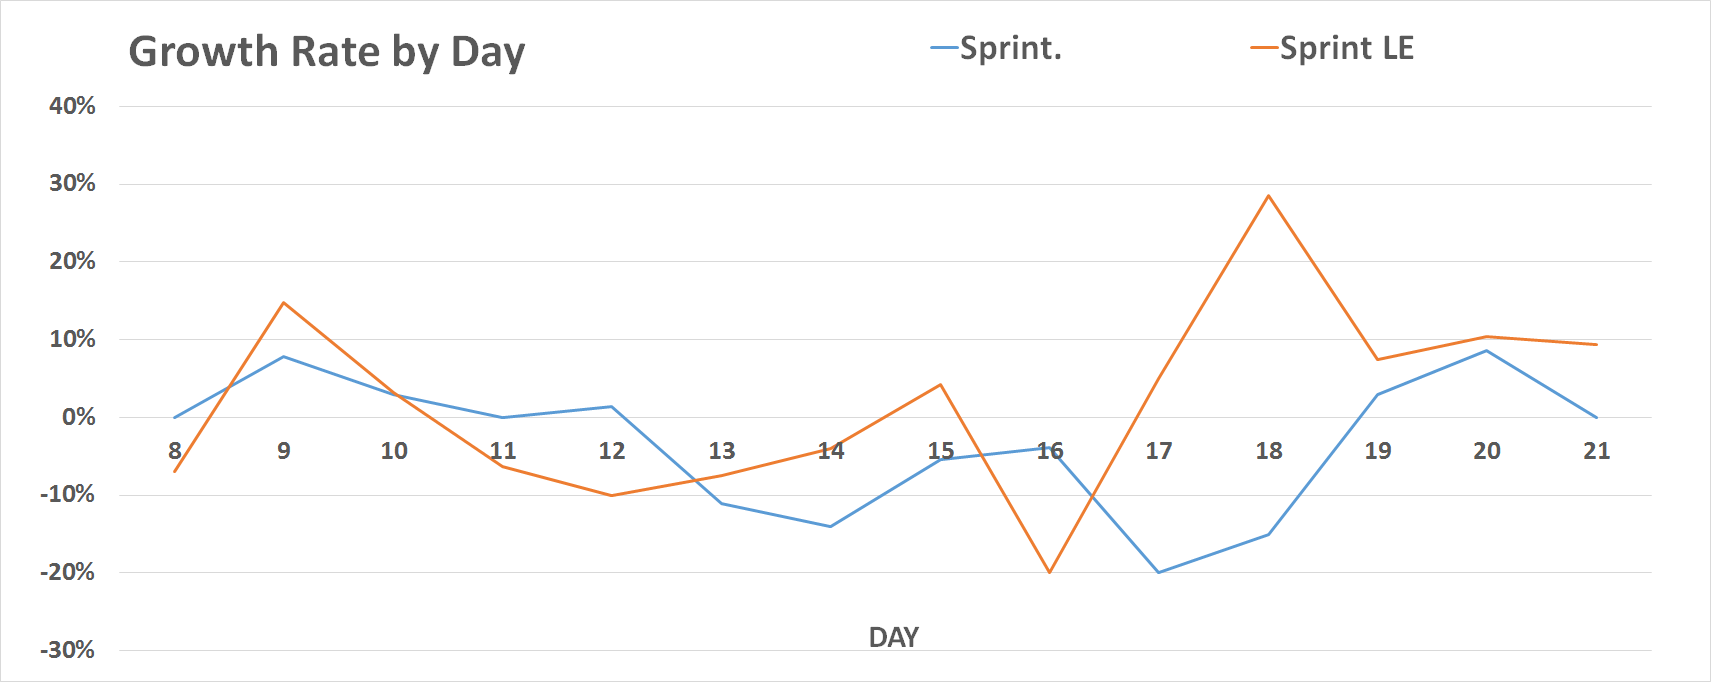 • The Sprint scooter had a higher growth rate in the first 7 days after launch than the Sprint LE scooter.
• The Sprint scooter's growth rate then declined, while the Sprint LE scooter's growth rate remained relatively stable.
• The Sprint scooter's growth rate eventually became negative, while the Sprint LE scooter's growth rate remained positive.
Based on these insights, it is possible that the launch date did have an impact on the sales of the two scooters. The Sprint scooter may have been more hyped up before launch, which could have led to higher initial sales and a higher growth rate.
Email Marketing Campaign
 The open rate for the campaign was 20%, which is slightly above the industry benchmark of 18%. However, the click-through rate was only 2%, which is below the industry benchmark of 8%. This means that only 2% of the people who opened the email clicked on a link in the email.
Based on the insights it is clear the the email campaign was not effective in influencing customer's purchasing decision.
INSIGHTS
Below are the general insights:
- The sales performance of Sprint Scooters exhibited an impressive start during the first two weeks of its launch. However, unexpectedly, there was a sudden decrease in sales by 20%.
- The sales volume showed promise during the initial week of release, up until October 17. However, it began to decline steadily thereafter.
- The Sprint scooter had a sharp decline in sales after day 10, while the Sprint LE scooter had a more gradual decline.
- The Sprint scooter's growth rate eventually became negative, while the Sprint LE scooter's growth rate remained positive.
- Only 2% of the people who opened the email clicked on a link in the email.
WHAT I LEARNED
-
Below is what I learned/practiced from this project:
- Complex SQL queries to extract required data for analysis.
- Use of table joins and aggregate window functions like rolling sum over a specified no. of rows, Analytical function, sub-query and common table expressions (cte).
- Pivot tables and graphs in Excel, edited the data tables along with creating different charts using pivot tables.
RESOURCES
I found this project/micro-experience on bluetick.ai website.